Analytics and BI Services
ZingZee builds dashboards and reporting that read the system of record directly, so takings, stock, margin and cash are current within seconds of the transaction. Access is set by role, every figure drills down to its source, and a question the dashboard cannot answer is put to the data in plain language.
- Cyprus, engineers across the globe
- Five-phase delivery
- Typed, tested, handed over
Dashboards that read the system of record as it changes
What analytics and BI are
ZingZee's analytics and BI services cover dashboards and management reporting that read a company's system of record as it changes, so takings, stock, margin, and cash are current within seconds of the transaction. Business intelligence, or BI, is the practice of turning the records in an ERP, a booking database, a bank feed, or a ledger into views a manager opens each morning. ZingZee mirrors or queries the source, keeps the mirror verified against it, and builds the dashboard on the mirror, so reporting never slows the operational system. Every figure drills down to the rows behind it and every row carries its source reference. For a business owner, this ends the wait for a report and the argument about where a number came from.

What we do with Analytics and BI
Business intelligence at ZingZee starts from where the numbers already live: an ERP such as SAP Business One, a booking database, a bank feed or a ledger. ZingZee's engineers mirror or query that source, keep the mirror verified against it, and build the dashboard on the mirror so reporting never slows the operational system. The retailer in the case studies sees each till sale on its dashboard within 30 seconds, counted net of returns.
Every figure on a dashboard drills down to the rows behind it, and every row carries its source reference, so a director who questions a margin opens the invoices in two clicks. Reports are built as views on the same data, which is why a new question is answered the same day instead of through a commissioned template.
Where a dashboard is not enough, an assistant sits over the same data with a fixed set of analysis tools, each of which returns the source query with the answer. Financial fields are stripped on the server for roles that should not see them, and a report can be produced as an on-screen table, a spreadsheet export or a branded PDF.
When to invest in analytics and BI
A company invests in analytics and BI when its managers wait for a report that the data could show live, when the month is known only after the accountant closes it, or when two departments quote two different figures for the same thing. It is the right choice when directors want to question a margin and open the invoices behind it in two clicks, and when owners, operators, and staff each need their own view of the same data with cost and margin visible only to the roles the business names. It suits a company whose numbers live in an ERP such as SAP Business One, a booking system, or a ledger that must stay untouched. ZingZee builds the dashboard inside the client's platform, on the same data model and roles, and runs it beside the old report until the two agree.
When a dashboard is the wrong answer
A dashboard is the wrong answer when the source data is wrong, because a live view of a bad number is a faster route to a bad decision, and the fix is in the capture process or the integration first. It is the wrong answer where a company already runs a BI product its team knows, in which case ZingZee supplies the verified data layer beneath it and leaves the tool alone. It is the wrong answer to a question that needs a one-off analysis, which is done as a query and a spreadsheet. ZingZee's assessment reads the source systems and the questions owners want answered before any view is proposed, and states which case applies.
Why Analytics and BI
Numbers current within seconds
The dashboard reads a verified mirror of the system of record, refreshed on a short cycle, so the day is known during the day.
Drill-down from any figure
A total opens into its rows and a row opens into its document, which ends the argument about where a number came from.
Role-based visibility
Owners see cost and margin, operators see quantities, and the server removes the restricted fields before the page is sent.
The source is never modified
Reporting runs on a mirror or a read-only connection, so a fault in the dashboard cannot reach the client's accounting system.
Questions answered without a template
New reports are built as views on the existing data, and an assistant answers ad hoc questions with the query shown.
Use cases
Daily trading for retail and distribution
Takings, margin, returns and best sellers by shop and channel, against the same day last year.
Live P&L, balance sheet and cash flow
Management accounts on the ledger as it stands, with budget against actual on every account code.
Stock and replenishment views
Lines near stock-out, slow stock with its cost value, and a morning pick list written from the numbers.
Booking and revenue analytics
Occupancy, lead time, channel mix and payment status across a portfolio of properties.
Progress and performance tracking
Attempts, scores and trends per user for training and assessment platforms.
Analytics and BI services ZingZee provides
Live dashboards on a verified mirror
ZingZee mirrors the ERP, booking, or ledger database through a read-only user over an encrypted connection, verifies the mirror against the source each night, and builds dashboards on the mirror that refresh within seconds and show the time of the last verified refresh.
Management accounts on the ledger as it stands
Live profit and loss, balance sheet, and cash flow with budget against actual on every account code, drill-down from any figure to its source line, and exports as a table, a spreadsheet, or a branded PDF.
Role-based views and field stripping
Owners see cost and margin, operators see quantities, and the server removes restricted fields before the page is sent, so one dashboard serves every role without a second copy of the data.
Reports as views and an assistant over the data
New questions are answered the same day as views on the existing data, and an assistant with a fixed set of analysis tools answers plain-language questions and returns the source query with each answer.
The verified data layer under an existing BI tool
Where a client already runs a BI product, ZingZee supplies the mirror, the verification, and the role model beneath it, so the tool reads numbers that reconcile to the source.
Analytics and BI scope
- Deliverables
- The verified mirror, the sync workers, and the dashboards or the data layer in the client's repository, live inside the platform with drill-down on every figure and exports working.
- Included as standard
- Nightly verification against the source, alerts on drift or a dropped feed, role-based access tested per role, a data dictionary for every figure, a runbook, and a recorded handover.
- Priced separately
- Each additional source system, the assistant over the data, seats in an existing BI tool, and views beyond the agreed set after go-live are scoped and quoted as separate items.
- What the client provides
- Read access to each source system, the definitions behind every figure as finance applies them, the access rules by role, and a person who signs off each view against the source.
- Outside the engagement
- BI tool licences, source-system access fees, and hosting contracts are the client's to hold. The mirror, the workers, and the dashboards carry no licence cost of their own.
How an analytics project
with ZingZee runs.
An analytics project with ZingZee runs through the five-phase delivery framework. The strategic assessment lists the source systems, the questions the owners want answered, the roles and what each may see, and the reports in use today. The AI roadmap fixes which views come first. Integration and deployment builds the mirror, the verification, and the dashboard, and runs it beside the old report until the two agree. Adoption and enablement puts the numbers in front of managers daily and trains the team that will add views. Governance, optimisation and scale keeps refresh times, reconciliation, and new questions under review. Each phase opens with a scoping workshop and closes with a hardening workshop, where the figures are reconciled to the source and the role model is tested, and a delivery workshop, where the client's managers sign it off.
Strategic assessment
We assess how the business operates today: its processes, its data and the systems it runs on. From that we identify the use cases with the highest return and confirm the organisation is ready to adopt them, so the programme starts from a defined baseline.
AI roadmap
Findings become a phased roadmap that balances early wins with the longer build. ZingZee sets the milestones, the resourcing and the governance that keep delivery on schedule and aligned to business objectives.
Integration and deployment
Our engineers develop, validate and deploy the solution into your production environment, integrated with the enterprise systems you already run and sized for the workloads it will carry.
Adoption and enablement
Enablement programmes prepare business users and technical teams to work with the new capability, and structured change management ensures the organisation captures the full value of what has been deployed.
Governance, optimisation and scale
Ongoing governance, monitoring and optimisation keep the solution accurate, compliant and performing. Proven solutions are then scaled across departments and regions under the same data governance standards.
Industries where ZingZee applies analytics
ZingZee has applied analytics and BI services in retail and distribution, where a warehouse dashboard over a SAP mirror shows each till sale within 30 seconds net of returns and writes a morning pick list; in financial services, where an accounting platform shows live profit and loss with drill-down to the source line; in travel and hospitality, where occupancy, channel mix, and payment status are read across a portfolio; in distribution, where an owner dashboard sits over an ordering platform; and in aviation training, where progress analytics track attempts and scores per user.
Analytics and BI tooling
ZingZee's analytics work uses one set of tools on every project, so a client who reads about a trading dashboard can expect the same on management accounts. The tooling covers:
- A Postgres mirror of the source system, kept in step on a short cycle and verified nightly
- Python sync workers with logging, retries, and alerts on drift or a dropped feed
- React and Next.js dashboards inside the client's platform, with drill-down on every figure
- Role-based access with restricted fields stripped on the server
- Exports as tables, spreadsheets, and branded PDFs
- An assistant with a fixed set of analysis tools that returns the source query with each answer
Analytics engineering practices
Every dashboard ZingZee ships reads a verified mirror or a read-only connection, so a fault in reporting cannot reach the client's accounting or ERP system. The mirror is reconciled to the source each night and the dashboard shows the time of the last verified refresh. Every figure drills down to its rows and every row carries its source reference. Access is by role, with restricted fields removed on the server before the page is sent. A new dashboard runs beside the old report until the two agree, and the differences are explained in writing. Reports are built as views on the same data, so a new question is answered the same day. At handover the client receives the mirror, the sync workers, the dashboard code, the role model, and a runbook for reconciliation and alerts.
Cost and time for live reporting
The cost of live reporting depends on the number of source systems, the access route each vendor allows, the number of views and roles, the reconciliation rules, and whether an assistant is in scope. A trading dashboard over one ERP mirror with a handful of views is a matter of weeks. Management accounts with budget against actual, drill-down, exports, and role-based views across several sources is a matter of months and goes live view by view. The verified data layer under an existing BI tool is priced after the sources are assessed. ZingZee provides a written estimate after the strategic assessment and phases the budget to the client's priorities.
What happens next?
You name the system the numbers live in and the three questions you cannot answer today.
An engineer reads it and replies within two working days with the shape of a strategic assessment.
You sign a non-disclosure agreement if you need one, and you receive a proposal with the phases, the estimate, and the team.
Related case studies.
Real projects, real numbers.
 EUR 45k cash released from slow stockRetailLive SAP mirror and replenishment tool for a stationery retailerA live mirror of the SAP database with a replenishment engine and an AI dashboard cut stock-outs on fast-moving lines from 8% to under 1%.Read the case study
  5,000 invoices cleared in 4 daysAccountingAutomated invoice processing and bank reconciliation for a Cyprus villa management groupAI invoice processing and automated bank reconciliation, built into a villa management group's own system, cleared a backlog of 5,000 invoices in four days.Read the case study
 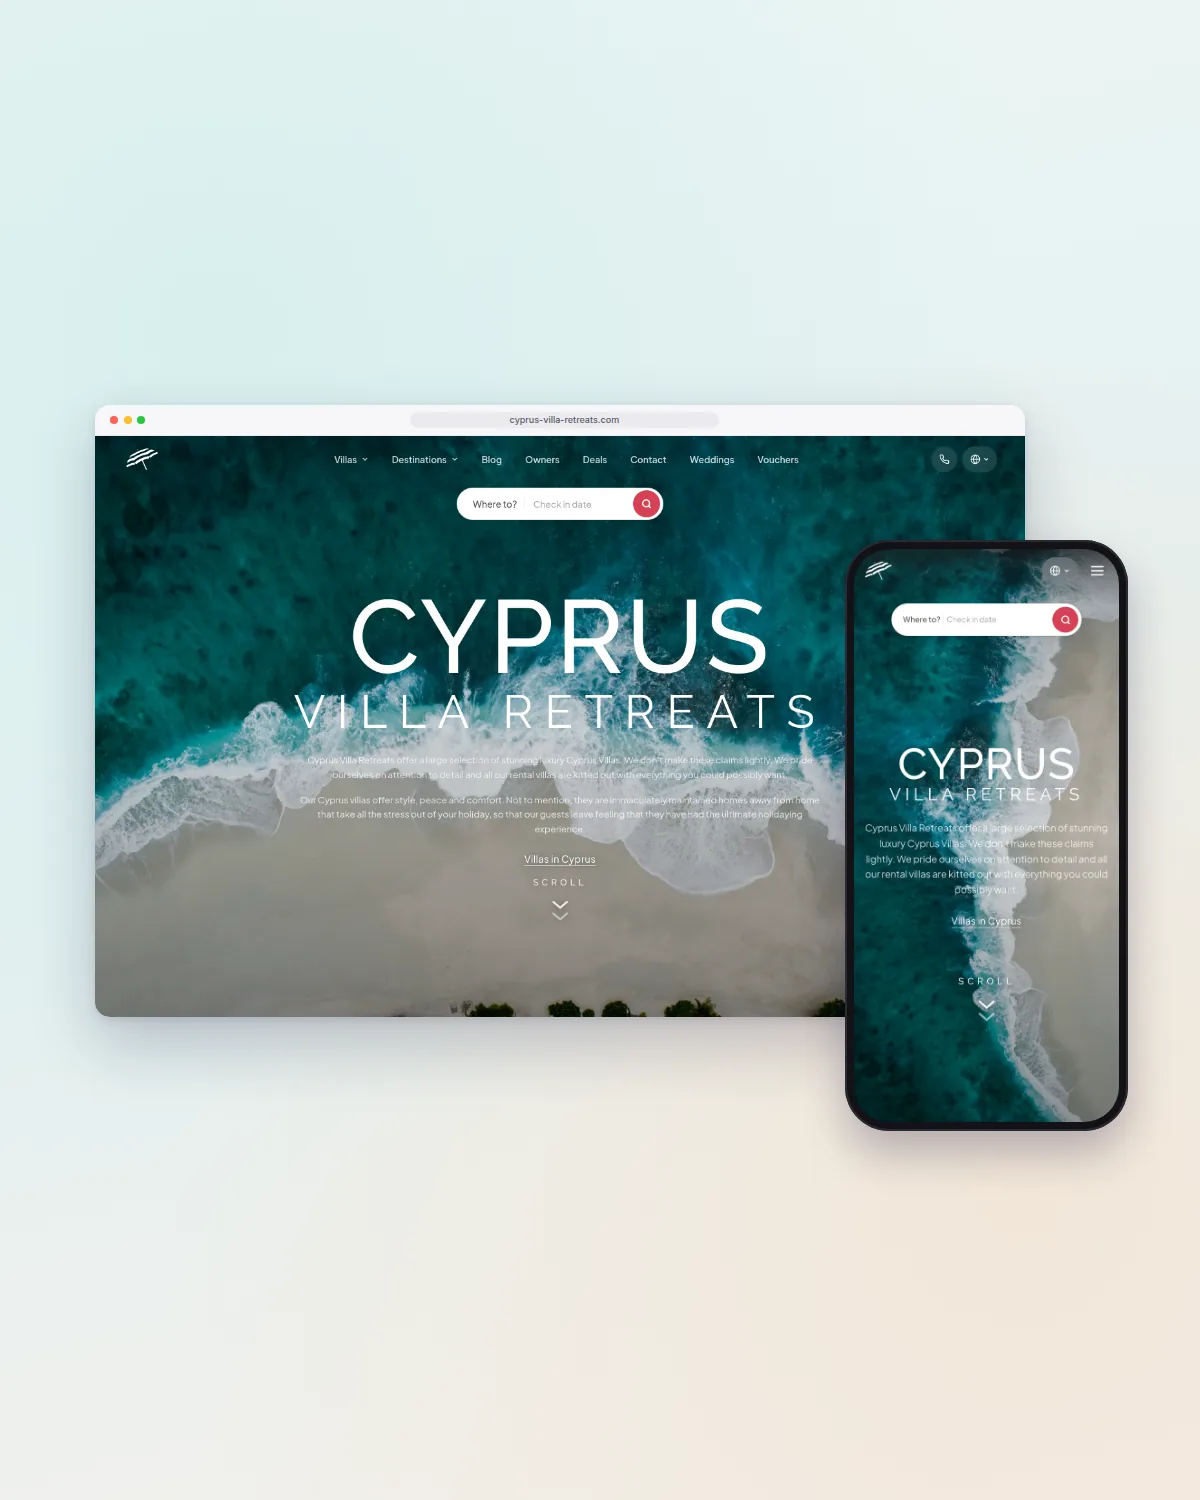 22 staff, from 58PlatformCustom booking and operations platform for Cyprus Villa RetreatsOne custom platform replaced more than 30 software products; the company now runs more than 450 villas with 22 staff, up from 70 villas and 58 staff.Read the case study
  0 order lines re-keyed into the ERPDistributionERP-integrated customer ordering platform for a wholesale distributorA customer ordering app integrated with the warehouse system and the ERP delivers orders as structured lines, and no order is re-keyed by hand.Read the case study
 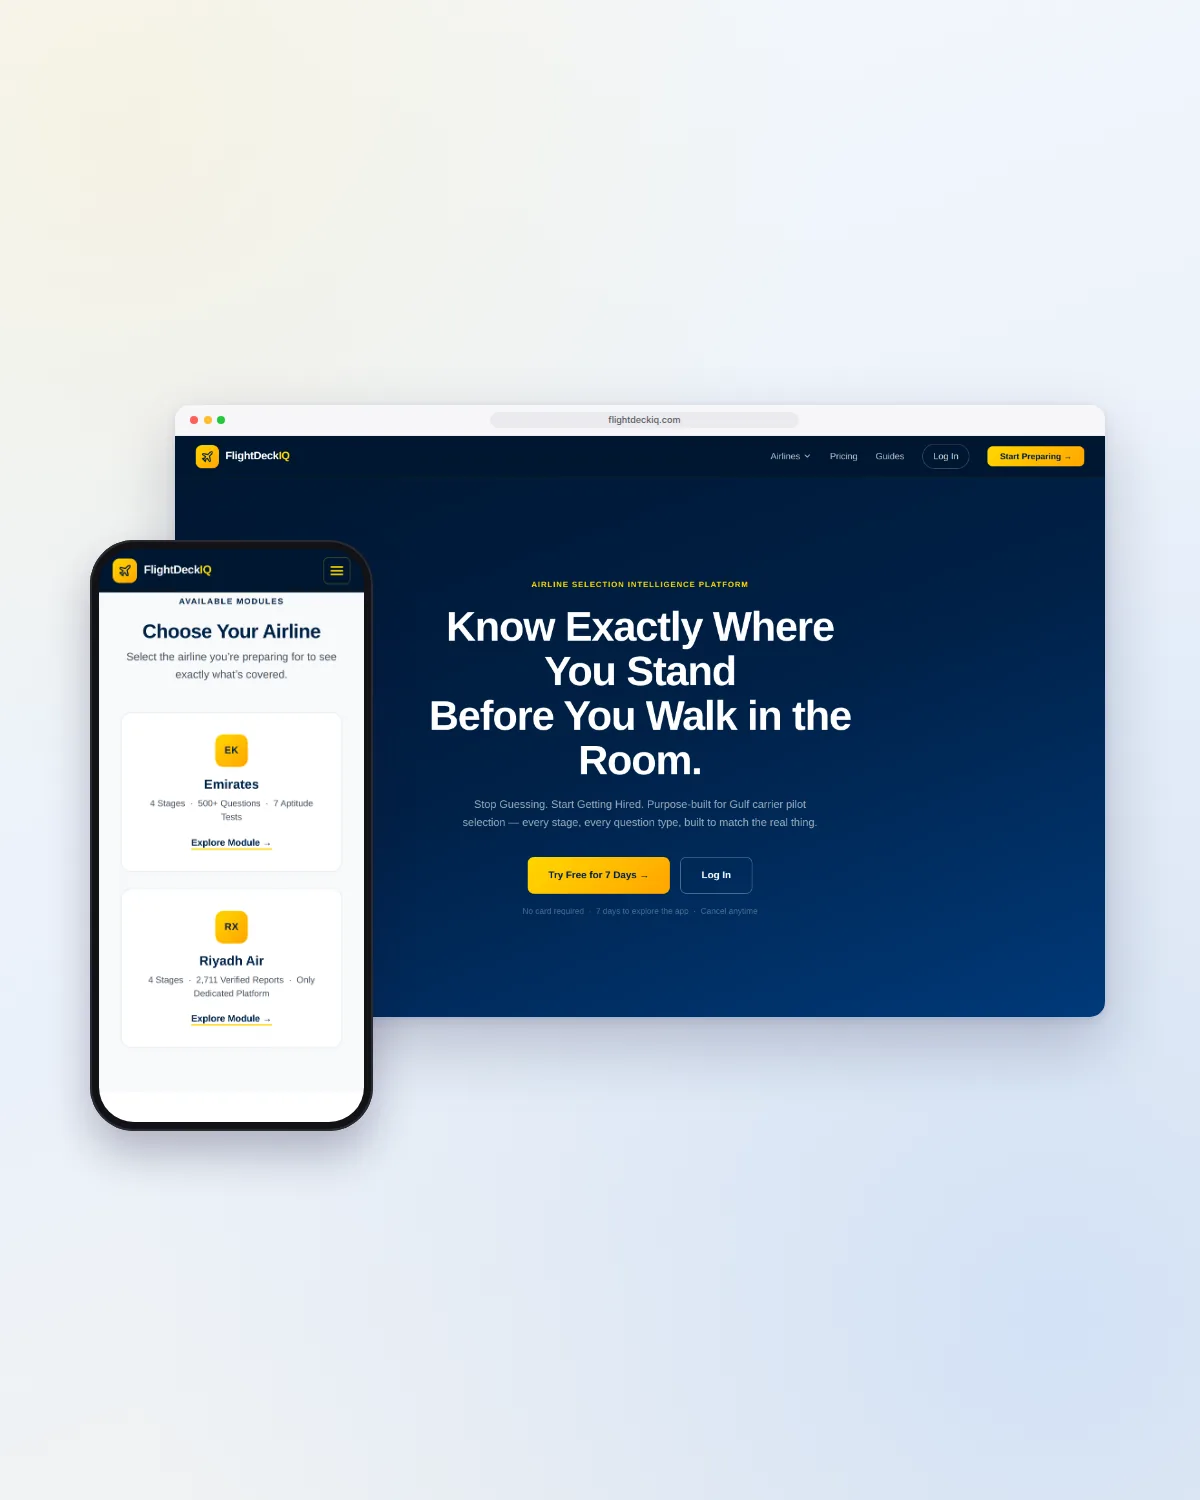 500+ practice questions in the first moduleProductAssessment preparation platform for commercial airline pilotsZingZee's own product combines study modules with seven aptitude test simulators built on the real selection process of each airline it covers.Read the case study
 Frequently asked questions
Straight answers on Analytics and BI work with ZingZee.